A Comparison of India’s support to farmers than other countries
An analysis of OECD data in comparison to the US, EU, China and Australia
Amid the of uproar on the new farm laws, which has kept the farmers on roads near Delhi borders for more than 40 days, let’s find out how much our government supports our farmers.
As per the study of Centre for WTO, the per-farmer Amber box support for India was just $49 (2018-19). It was $7,253 in the United States (2016), $7,414 in Canada (2016), $1,068 in the EU, $222 in Australia (2017-18), $8 in Bangladesh and $7 in Indonesia (2018).
The study also revealed that per-farmer total domestic support (includes green, amber, blue and development boxes put together) in India was mere $282 in 2018-19. It was $61,286 in the United States, $13,010 in Canada, and $8,588 in European Union.
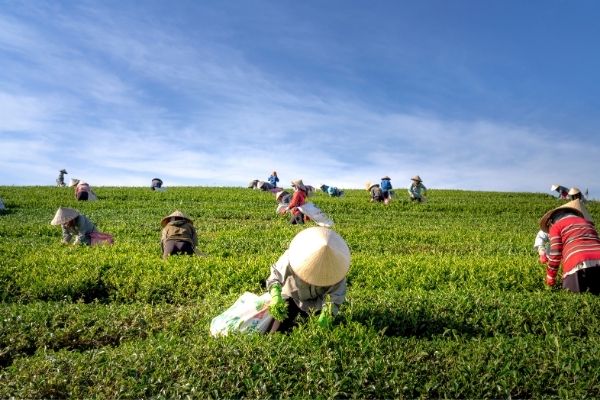
Farmers of Punjab and Haryana think that the news farm laws will rob them of their traditional social safety net. They do not view farming just as a job but also the fall-back option when other ventures fail. Farming gives them an option to eke out a living, however meagre, when they are not able to participate in other sectors of the economy- services and industries sector.
This perhaps explains why the agriculture sector employs almost half of India (44 per cent) despite contributing just 15 per cent in the total GDP of the country.
Read more: It feels like farmers’ protest is benefitting traders more, rather than farmers. Here’s why?

Analysis of recent OECD data
OECD (Organisation for Economic Co-operation and Development) provides 5 sets of data on the issue of agricultural support which shows that India trails on most counts. We have compared India’s data with the United States, China, the European Union and Australia.
PSE
Producer Support Estimates are the transfer to agricultural producers and are measured at the farm gate level. They include the cost of revenue foregone, market support price and budgetary payments.
CSE
Consumer Support Estimates refer to transfers from consumers of agricultural commodities. They are measured at the farm gate level. The report clarifies that if negative, the CSE measures the burden (implicit tax) on consumers through market price support.
GSSE
General Service Support transfers are linked to measures taken by the government for enabling conditions for the primary agricultural sector through the development of public or private services, infrastructure and institutions. They include policies where primary agriculture is the main beneficiary but does not include individual payments to farmers. The report says that GSSE does not directly alter producer receipts or consumption expenditure or costs.
TSE
Total Support Estimate represents the total support granted to the agriculture sector which all the three PSE, CSE and GSSE.
PP
The Organization for Economic Co-operation and Development also provides data on “producer protection”. It is the ratio between the average price received by farmers including the border price and payments per unit of current output. For Example -China has a coefficient of 1.10. This means that farmers of china received prices that were 10 per cent above the international market levels.
The country report of OECD says that India’s support to producers in India is composed of budgetary spending corresponding to 7.8 per cent of gross farm receipts, negative market price support of negative 14.8 per cent among those which are implicitly taxes, and positive market price support of positive 2.0 per cent of gross farm receipts among those commodities which are supported. Overall this leads to negative net support of -5.0 per cent of gross farm receipts in 2017-19.
The negative value of the PSE reflects that overall farmers continue to be implicitly taxed, as budgetary payments to farmers do not offset the price-depressing effect of trade policy measures and complex domestic regulations.
The report further states that the policies of India support consumers more than farmers. Policies that affect farms prices along with food subsidies has reduced consumption expenditure by 21.4 per cent on average across all commodities in 2017-19.
Have a news story, an interesting write-up or simply a suggestion? Write to us at info@oneworldnews.com